IELTS Academic Writing part 1, test 4
You should spend about 20 minutes on this task.
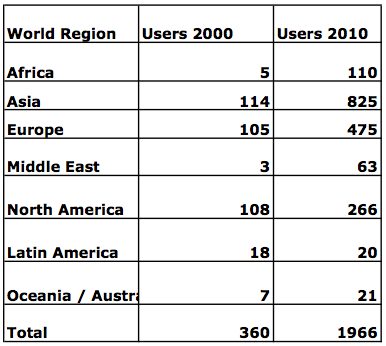
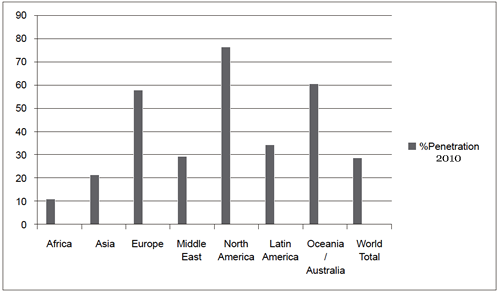
The table and bar chart below give information about internet users by region in 2000 and 2010.
Summarise the information by selecting and reporting the main features, and make comparisons where relevant.
Write at least 150 words.


IELTS Academic Writing part 1, test 4
2021 © Exam English Ltd. ALL Rights Reserved. Home | Terms of Use | Privacy policy