IELTS Academic Writing part 1, test 1
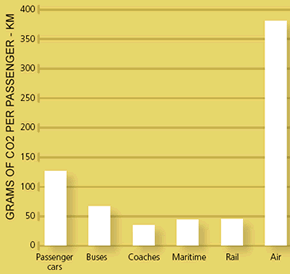
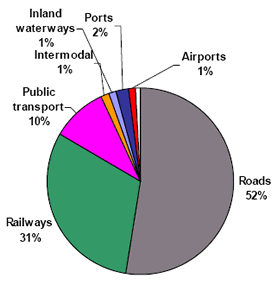
The table below shows CO2 emissions for different forms of transport in the European Union. The Pie Chart shows the percentage of European Union funds being spent on different forms of transport.
Write a report for a university lecturer describing the information shown below.
| CO2 emissions per passenger kilometre |
 |
| EU Funds for transport 2007-2013 | |
 |